Commercial Real Estate: Perspectives on Historical Returns and the Current Cycle
Human nature and psychology can be just as powerful as reasoning when it comes to investing. Investors and advisors tend to fight yesterday’s battles recalling painful memories of previous downturns which inevitably leads to attempts at market timing. But, much like yesterday, nobody can predict the future and attempts to do so may ultimately result in unintended consequences and poor performance.
Despite recent strong performance, an emerging argument is that commercial real estate has performed so well, valuations must be on the cusp of a material decline. However, markets are rarely so simple. One could have thought the same thing in2016, for example, after commercial real estate’s 7-year bull run of nearly 117% cumulative return. But, the NCREIF Property Index (or NPI, which is the leading institutional real estate index), is up another cumulative 58% since then, even accounting for a global pandemic-induced recession1. Simply rising valuations over time don’t necessarily lead to falling ones. How can investors evaluate the market without purely relying on historical valuations? We believe that focusing on market fundamentals can lead to a more effective assessment of the market, its drivers, and potential pitfalls.
“Nobody can predict the future and attempts to do so may ultimately result in unintended consequences and poor performance.”
Three Indicators to Watch: Overbuilding, Overleverage, and Job Losses
The NPI has a 44-year history, enough to reveal how real estate performs in a variety of economic and political environments. The index has experienced only two negative returning periods (four calendar years), but the 40 up years and four down years reveal a great deal about what decreases valuations and what doesn’t. The “dot-com” crash leveled the Nasdaq Composite Index in 2000, but institutional real estate was positive, not only in 2000, but the years around it. A global pandemic and brief severe downturn in GDP in 2020 resulted in negative returns for a single quarter, and didn’t result in losses for the calendar year. Although most market participants would acknowledge that current real estate pricing has pulled back somewhat in 2022 due to higher interest rates, evidence also shows robust support for future appreciation despite higher borrowing costs and thus, we believe that a significant downturn in prices may not materialize. It turns out there are three, sometimes interrelated key conditions that tend to result in significantly declining valuations on an asset class level: Excessive supply (or overbuilding), rapid growth in mortgage debt (or excessive leverage), and increases in unemployment (or significant job losses); none of which appear to be occurring on a national scale.
No Overbuilding: New Construction Levels are at Historic Lows
New supply of commercial real estate as a percentage of total inventory was the lowest in the trailing 10-year period compared to previous 10-year periods (see Chart 1 below). The forecast below shows the next five years to be similar the previous 10. Low supply deliveries keep vacancy rates low which puts upward pressure on rents, and thus, sustained values.
Commercial Real Estate Supply
Cumulative and Average New Supply (% of Stock)
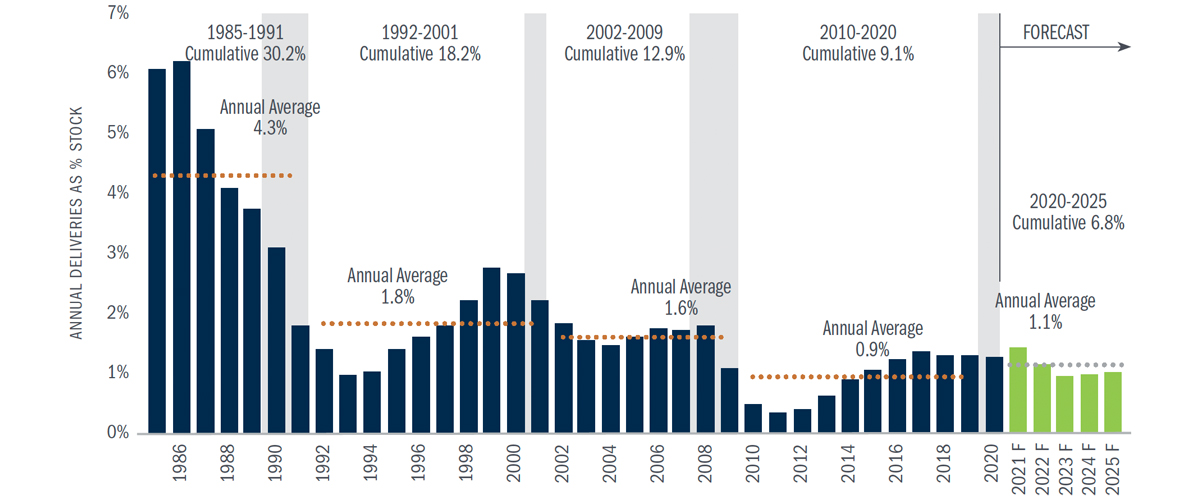
Source: CBRE-EA, Clarion Partners Investment Research, Q2 2021 Note: Forecasts were provided by Clarion Partners Investment Research as of Q2 2021 based on historic data from CBRE-EA. Cumulative new supply was calculated from the beginning of the cycle to the end of recession. Past performance is not indicative of future results. Forecasts have certain inherent limitations and are based on complex calculations and formulas that contain substantial subjectivity and should not be relied upon as being indicative of future performance.
Why do we believe that low supply level forecasts will persist despite strong demand? Simply stated, because of higher construction costs. With construction material costs over 35% higher today as compared to March 2020, it has become very expensive to deliver new supply, which even excludes rising land prices (see Chart 2 below). Replacement rents may continue to rise to meet the new construction cost levels to reach the real estate market equilibrium. That is good news for existing real estate values.
PPI Construction Materials
Producer Price Index (PPI) for Construction Materials (2000-2021)
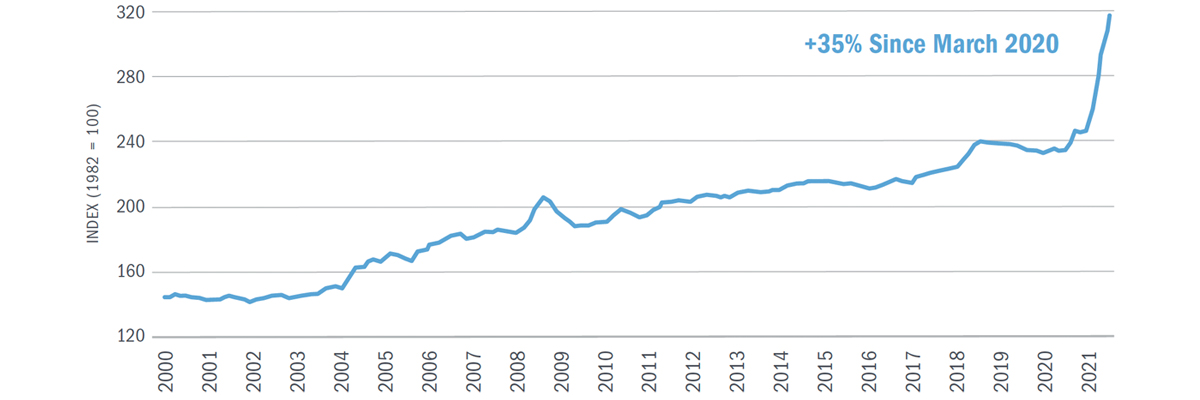
Source: U.S. Bureau of Labor Statistics, Clarion Partners Investment Research 2021
No Overleverage: The Lending Market has been More Disciplined than in Prior Cycles
Levels of mortgage debt are a critical driver in the growth of real estate values. Historically, during the two periods when there has been explosive growth of commercial mortgages over a multi-year cycle, the institutional real estate index experienced its declines in value over its 44-year history. In the 13-year period following the Great Financial Crisis of 2008-09, the growth in commercial mortgage debt was modest, which historically results in very few forced sales in modest downturns and thus, provides support for values.
Commercial Mortgage Debt
Cumulative Growth in Commercial Mortgage Debt from Trough of Prior Business Cycle
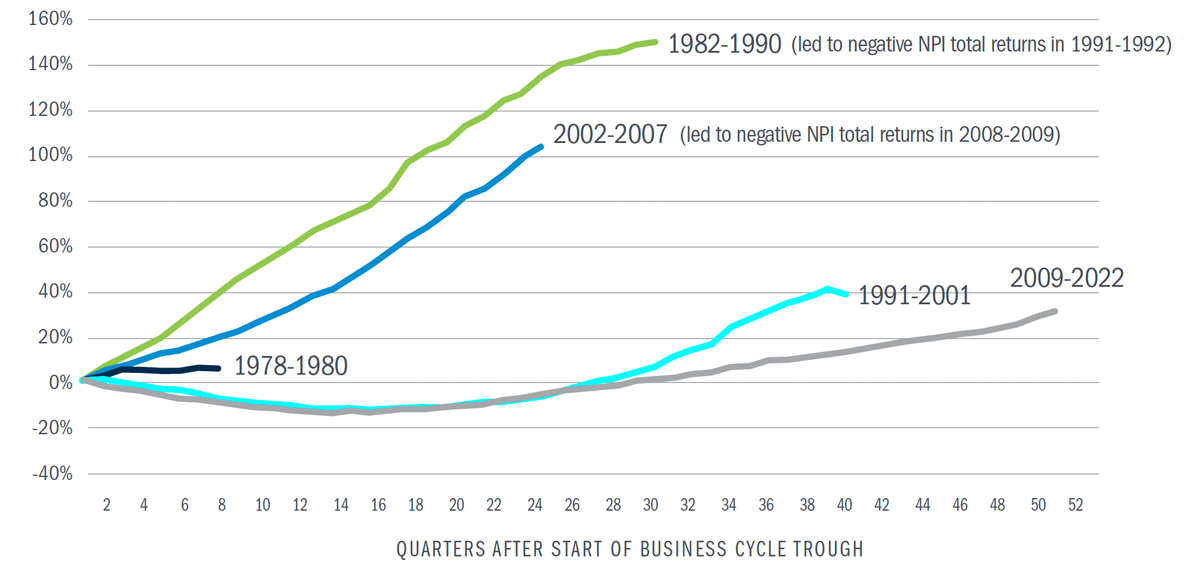
Source: Bluerock analysis of Federal Reserve Z.1, Flow of Funds. National Council of Real Estate Investment Fiduciaries
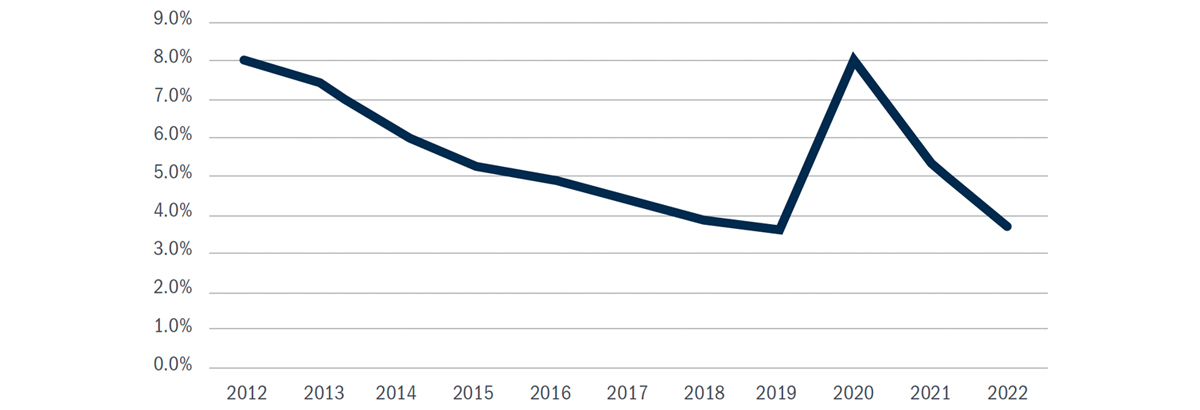
No Significant Job Losses: The Economy is Creating Large Amounts of Net New Jobs and Unemployment is Low
The U.S. economy created 528,000 net new jobs in July 2022, bringing the unemployment rate to 3.5%. This matches the lowest level in the last 10 years. When unemployment is low and job growth high, people tend to form households, which tends to be very good for real estate demand. New households seek new residences for rent or sale; they buy goods, whether online or in store; they work, in offices or elsewhere; and they tend to travel more. Generally speaking, almost all real estate sectors benefit. Real estate pricing responds to this demand, and rents historically have not declined in these types of economic and low unemployment environments.
Historical Unemployment
Unemployment Rate
Source: Bureau of Labor Statistics
You’re bound to read it or hear it again, from news outlets, a soundbyte, a clickbait story, or maybe your client. But, the next time you see or hear a prediction for the next great real estate collapse, consider the three major indicators of overbuilding, overleverage, and significant job losses before you hit the exit button.
1 National Council of Real Estate Investment Fiduciaries (NCREIF) National Property Index (NPI).
This information is educational in nature and does not constitute a financial promotion, investment advice or an inducement or incitement to participate in any product, offering or investment. Bluerock is not adopting, making a recommendation for or endorsing any investment strategy or particular security. All opinions are subject to change without notice, and you should always obtain current information and perform due diligence before participating in any investment. All investing is subject to risk, including the possible loss of principal. Bluerock cannot guarantee that the information herein is accurate, complete or timely. Past Performance does not guarantee future results.

