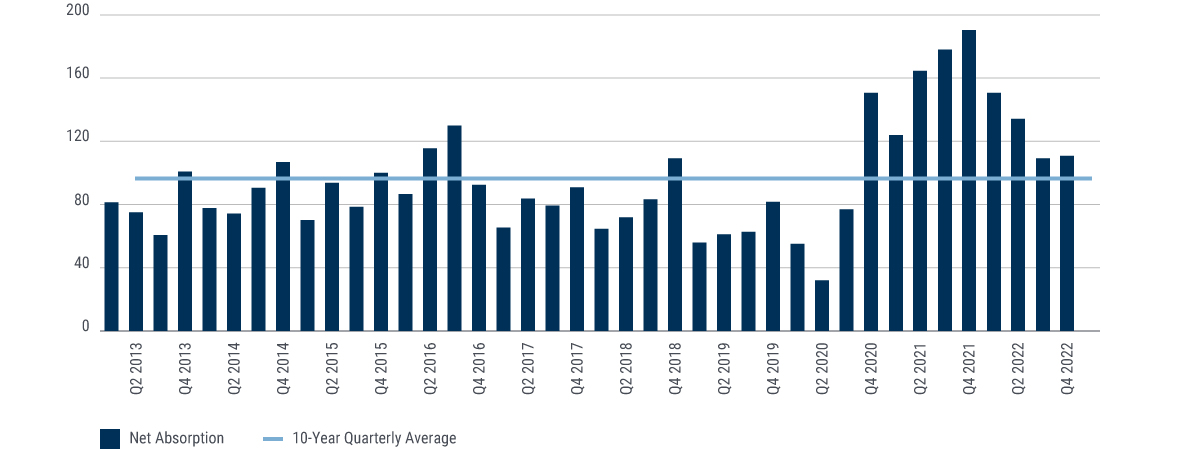
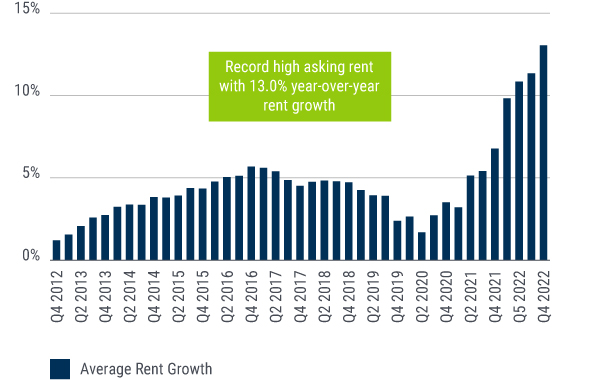
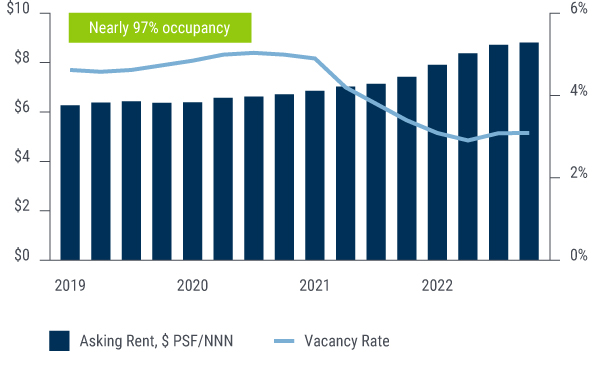
Despite volatility seen in the real estate market, Bluerock still maintains high conviction in the industrial sector which is poised to maintain its durability due to:

  • Growth of e-commerce
  • Structural shifts in the supply chain
  • Unprecedented demand for industrial space with limited supply.

“Industrial real estate is the engine of the global economy.”


Since the beginning of the COVID-19 Pandemic, the e-commerce industry has seen record growth, driving even higher demand for the industrial real estate industry which serves the function of both warehousing and distribution function for retailers. This growth is expected to continue with Green Street projecting a 6.6% compounded annual growth rate through 2028. As shown in the chart below, e-commerce is expected to more than double as a percentage of retail sales from approximately 15% in 2023 to nearly 40% by 2040.

E-Commerce % of Total Retail Sales
40% 30% 20% 10% 0% 2000 2002 2004 2006 2008 2010 2012 2014 2016 2018 2020 2022 E2024 E2026 E2028 E2030 E2032 E2034 E2036 E2038 E2040 Actual Projected E-Commerce Share of Retail Ex MotorVehicles, Parts, and Food Services (%) PROJECTED GROWTHE-COMMERCE SALES EXPECTED TO MORE THANDOUBLE AS PERCENTAGE OF RETAIL SALES $1.1T+ Online Sales 8.6% Increase Year-Over-Year

Sources: U.S. Census Bureau, May 2024 | Projections from CBRE EA: Pandemic Accelerates E-Commerce Adoption Implications for Industrial and Retail. The percentages presented for future periods are projections and there is no guarantee that these projections will accurately reflect future performance. E-commerce sales are sales of goods and services where the buyer places an order, or the price and terms of the sale are negotiated over the Internet, mobile device (M-commerce), extranet, Electronic Data Interchange (EDI) network, electronic mail, or other comparable online system. Payment may or may not be made online. Online travel services, financial brokers and dealers, and ticket sales agencies are not classified as retail and are not included in either the total retail or retail e-commerce sales estimates. Projections are for 2030 and 2040 and not annual, each year estimated based on 2030 and 2040 projection.

E-commerce growth directly increases the demand for industrial space. The chart below underscores e-commerce alone will result in demand for an additional 527 million square feet of industrial space through 2028.

HISTORICAL $0 $500 $1,000 E-COMMERCE SALES (IN BILLIONS $) $1,500 $2,000 PROJECTED +$421B New E-Commerce Sales=527M New Industrial SF Needed +$74B=92M SF +$79B=98M SF +$84B=105M SF +$89B=112M SF +$95B=119M SF E-COMMERCE SALES | 2017–2028 2017 $545 2018 $524 2019 $602 2020 $722 2021 $870 2022 $1,033 2023 $1,119 2024 $1,193 2025 $1,271 2026 $1,355 2028 $1,540 2027 $1,445 5X growth comparedto brick and mortar Total Industrial Demand to require nearly an additional2 billion square feetfrom 2023 to 2027 3X WAREHOUSE SPACE Generally required by e-commerce tenants compared to traditional retail STRUCTURAL DEMAND

Source: Based on near term E-commerce projections from Green Street Industrial Outlook, January 2024. $1 billion of e-commerce sales requires approximately 1.25 million square feet of industrial space.

The popularity of e-commerce began to rise in the early 2010’s. E-commerce requires more available inventory than just-in-time logistics, leading to retailers holding more inventory on hand, often in warehouses. Recent global supply chain disruptions could further boost warehouse demand if companies are forced to carry more “safety” inventory. As shown below, this shift to more available inventory appears to have begun, which should create heightened warehouse demand.

Retailer Inventory-To-Sales Ratio
1.0x 1.1x 1.2x 1.3x 1.4x 1.5x 1.6x 1.7x 1.8x “Just-in-Time”Revolution EcommerceRequires MoreInventory Covid +Supply ChainIssues Recovery? ‘93 Headline Metric ‘95 ‘97 ‘99 ‘01 ‘03 ‘05 ‘07 ‘09 ‘11 ‘13 ‘15 ‘17 ‘19 ‘21 ‘23 Warehouse Inventory Index

Source: Green Street 2024 Industrial Outlook. Green Street Warehouse Inventory Index adjusts for various nuances around product size and proclivity to be stored in warehouses (e.g., auto inventory is stored on dealership lots, not warehouses) to provide a more accurate reading of goods in logistics facilities.

The industrial sector continues to exhibit strong fundamentals, resulting in 52 consecutive quarters of positive rent growth. (Source: CBRE Q1 2024 Logisitics and Industrial Figures). As shown below, this positive absorption is projected to maintain high occupancy rates of approximately 96% through 2028.

Quarterly Net Absorption (MSF) | 2013-2022
82% 84% 86% 88% 90% 92% 94% 96% 98% -200 -100 0 100 200 300 400 500 600 2006 Net Absorption (MSF) 2007 2008 2009 2010 2011 2012 2013 2014 2015 2016 2017 2018 2019 2020 2021 2022 2023 Estimated 2024 2025 2026 2027 2028 New Supply (MSF) Occupancy (LHS)

Source: Green Street 2024 US Industrial Outlook

Driven by strong occupancy, the industrial sector is projected to outpace inflation with rent growth averaging more than 4% annually from 2024 through 2028.

Industrial U.S. M- RevPAF Growth
2006 Market Rent Growth 2007 2008 2009 2010 2011 2012 2013 2014 2015 2016 2017 2018 2019 2020 2021 2022 2023 2024* 2025* 2026* 2027* 2028* Occupancy Changes 5% 3% -2% -11% -6% 1% 3% 5% 6% 6% 7% 6% 5% 6% 3% 18% 26% 5% 3% 5% 5% 4% 4% 2024-2028* CAGR = 4% * Outlook estimate

Source: Green Street 2024 US Industrial Outlook
M-RevPAF is Market Revenue Per Available Foot and combines changes in effective rents and occupancies into a single measure.

According to CBRE, new development will remain low for the foreseeable future, due to strict lending conditions and economic uncertainty. Since demand is expected to remain heightened, this sets the stage for industrial sector fundamentals to quickly tighten creating a possible “goldilocks” environment for investors.

Industrial Construction Starts
140 120 100 80 60 40 20 0 67.2 94.5 117.1 99.8 110.5 100.2 113.5 85.8 68.2 54.2 40.5 35.0 40.0 40.0 50.0 55.0 Q1 2021 Q2 2021 Q3 2021 Q4 2021 Q1 2022 Q2 2022 Q3 2022 Q4 2022 Q1 2023 Q2 2023 Q3 2023 Q4 2023 Q1 2024 Q2 2024 Q3 2024 Q4 2024 Forecast MSF -65%

Source: CBRE, U.S. Real Estate Market Outlook 2024

Bluerock believes the industrial sector is poised to continue to provide positive risk-adjusted returns for investors due to the growth of e-commerce, structural shifts in the supply chain, and unprecedented demand for industrial space with limited supply.

This information is educational in nature and does not constitute a financial promotion, investment advice or an inducement or incitement to participate in any product, offering or investment. Bluerock is not adopting, making a recommendation for or endorsing any investment strategy or particular security. All opinions are subject to change without notice, and you should always obtain current information and perform due diligence before participating in any investment. All investing is subject to risk, including the possible loss of principal. The information contained herein is sourced from third parties and Bluerock makes no assurances with respect to its accuracy, completeness or timeliness. Past Performance is not necessarily indicative of future results.