Long-Term Real Estate Investors Don’t Need to Call the Bottom
Institutional real estate, a long-coveted asset class, was first officially measured in the U.S in 1978 by the NCREIF Property Index (NPI). The NPI has an enviable 45+ year track record with a nearly 9% total annualized return, an average of nearly 7% annual income returns, 41 of 45 positive returning years, and lower volatility more akin to the investment grade bond market than to equity markets. These characteristics have long drawn interest from pension funds and endowments as a key component in a well-diversified portfolio.
Like any other investment, institutional real estate performance is difficult to time. In institutional real estate, the effort of market timing yields even fewer results than timing the equities markets. The high volatility of equities attracts the attention of would-be market timers as returns over 5- and 10-year forward horizons can be wildly different depending on investors’ entry points. For example, consider that S&P 500 forward 5-year and 10-year return differences from 1978 through Q2 2023 are more than twice the NPI forward 5 and 10-year return differences. In fact, forward 10-year returns for the NPI have never been lower than 4% annualized, and this assumes the hypothetical investment was perfectly mistimed in the worst 10-year stretch since the index’s inception.
NPI vs. S&P 500 Rolling 10-Year Annualized Returns
NPI inception Q1 1978 – Q2 2023
| Maximum | ||
| Minimum | ||
| Average | ||
| Max/Min Spread | ||
| Drawdowns > 10% |

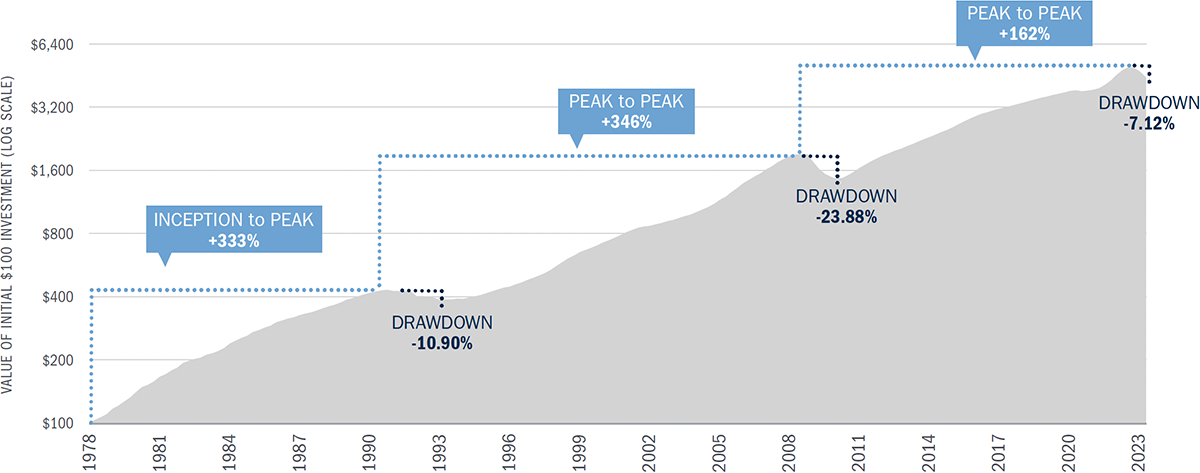
As highlighted by the chart below, the NPI’s relatively low volatility and the three major drawdowns since index inception present a long-term buying opportunity more so than a short-term trading opportunity. The Index recently declined in total return for three consecutive quarters from Q4 2022-Q2 2023. Examining the previous two drawdowns after three quarters from their inception, we find forward 10-year annualized returns of 8.24% and 9.25% are quite close to the long-term annualized return of the Index.
The NPI’s historical expansions have been remarkably long, typically well over a decade, and have produced significant three-figure cumulative gains. On the risk side, the drawdowns have been relatively short and significantly smaller when compared to equity markets.
NCREIF Property Index (NPI) Cumulative Growth
Q1 1978 – Q2 2023

An investment into the asset class during one of these few downturns would have been rewarded with a subsequently long expansion period. The research team at Bluerock sees the current decline as potentially following this pattern. Exact troughs are rarely timed, but history suggests subsequent returns reward those investing for the long term during the decline.

