Public REITs’ Predictive Power of Private Real Estate Values Might be Weaker Than You Think
A widespread school of thought suggests that public REIT performance is a leading indicator of private real estate values. However, our analysis shows a very weak relationship between the two and fluctuations in private real estate values can be best explained by other factors.
MAXIMUM DRAWDOWN: A KEY METRIC
- Drawdown is a widely used measure to assess the frequency and severity of previous downturns in an investment. It measures the percentage value loss from a previous high point before reaching a new high.
- By measuring the difference between the high values and the low values of an investment, drawdown indicates potential downside.
- Drawdown analysis can be very important since proportionally higher gains are required to overcome them. For example, a 25% gain is needed to overcome a 20% decline to return to breakeven.
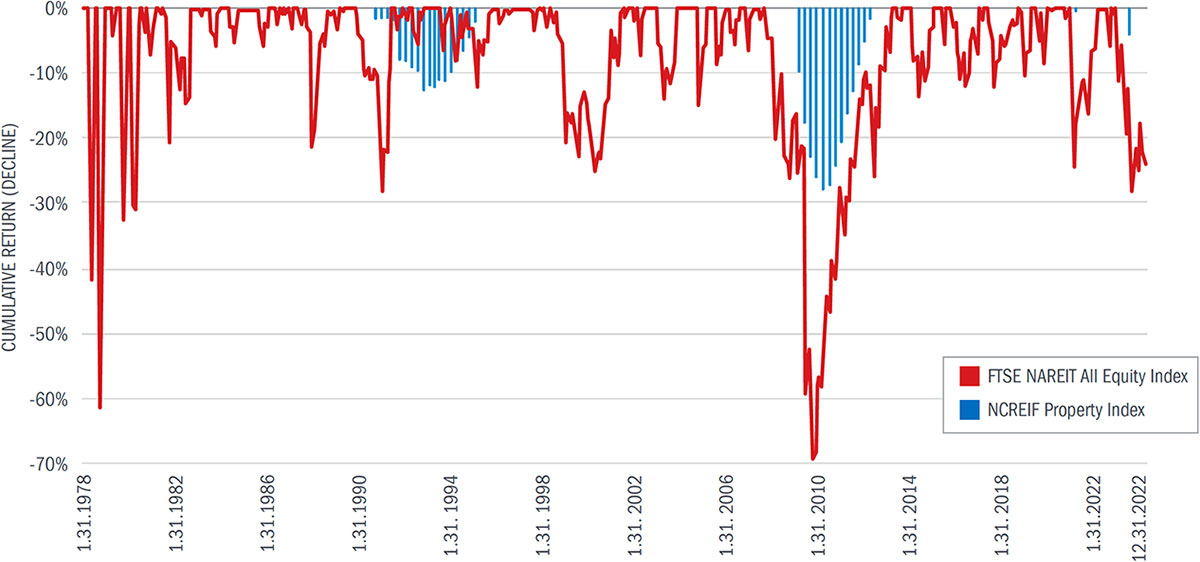
In this analysis, we analyzed all drawdown periods of public REITs, as measured by the FTSE NAREIT All Equity Index, and compared those periods with private real estate drawdowns as measured by the NCREIF Property Index (NPI). Not only have public REIT drawdowns been much larger and more frequent, in only 3 of over 30 cases have they been followed by private real estate declines. These three periods have also been defined by very significant economic events, implying that the type and magnitude of the economic event rather than the public REIT drawdown better portends a private real estate value decline. The three events, the Savings & Loan Crisis, Global Financial Crisis, and the Fed Funds rate increase of 2022-23, all impacted the cost and availability of real estate and other financing negatively, impacting all asset prices. The public REIT drawdown didn’t necessarily predict a private market value decline, but rather the private market decline was the result of other concurrent events where most asset prices corrected. We believe this because every other time public REIT values declined under 15% since 1978 (approximately 20 times), the NPI did not concurrently or subsequently decline.
Immediately below is a chart showing private real estate drawdowns (as shown by the columns) and publicly traded REIT drawdowns (as shown by the red lines), since 1978. This shows the three private market declines amidst all 30+ of the public REIT drawdowns.
Public REIT and Private Real Estate Drawdowns

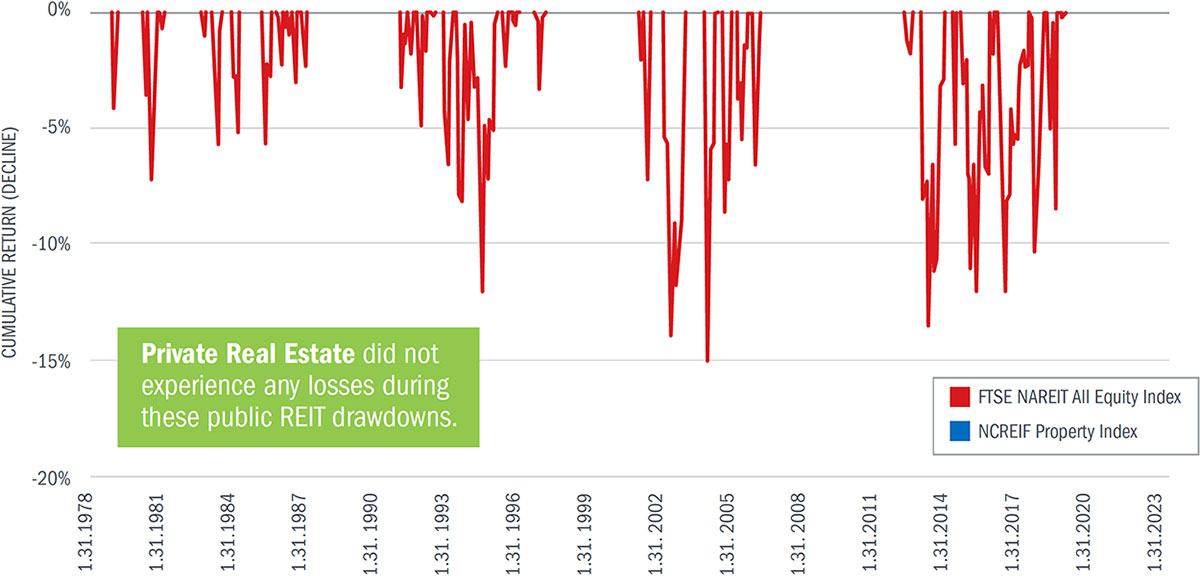
In the subsequent graphs, we split these 30+ public REIT drawdowns into two categories: the first category includes only those periods where public REITs experienced a drawdown of -15% or less and the second category includes only those periods where public REITs experienced a drawdown greater than 15%.
During the periods when public real estate drawdowns were less than 15%, there were no associated drawdowns in private real estate, illustrated below.
Public REIT Drawdowns of -15% or Less, With Commensurate Private Real Estate Drawdown

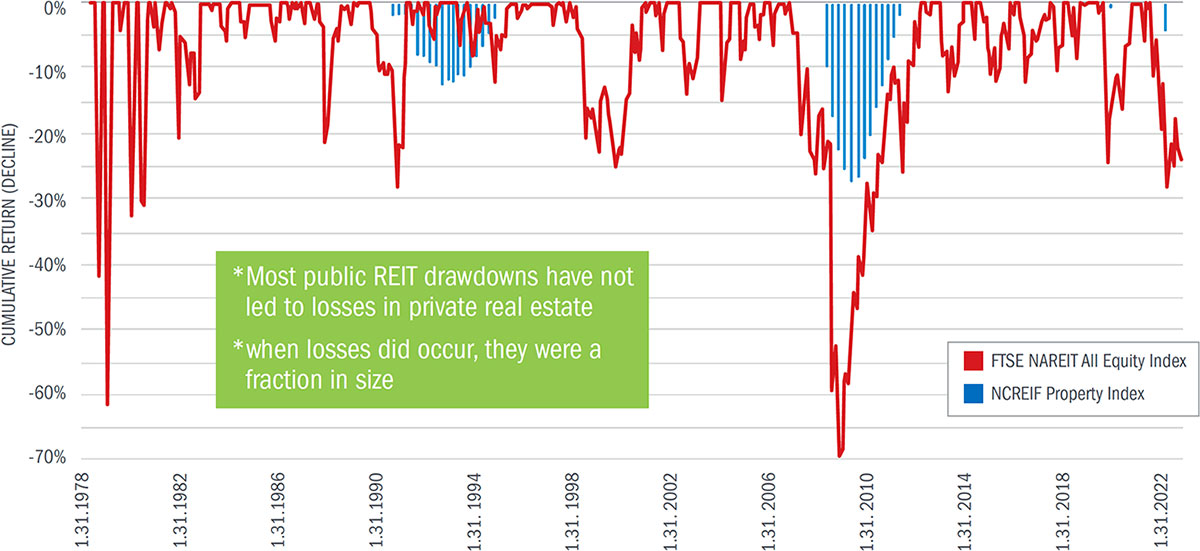
In contrast, the chart below shows the public REIT drawdowns greater than 15%. Even with the greater magnitude of the public REIT drawdown, there still are only three smaller private real estate value declines which were driven by distressed macroeconomic conditions (such as a challenged lending environment).
Public REIT Drawdowns of -15% or Greater, With Commensurate Private Real Estate Drawdown

Public REITs: FTSE NAREIT All Equity REIT Index; Private RE: NCREIF Property Index
It’s clear from the first chart that most public REIT drawdowns have not led to private real estate drawdowns. Furthermore, where private real estate values did decline, the magnitude was one-half to one-third in size of the comparable public REIT drawdown. The number of drawdown periods and the timing of drawdown periods suggest that public REIT performance has not predicted private real estate performance with a high degree of confidence. The drawdown periods in private real estate appear to be linked to broader macro-economic issues, not simply by declines in public REIT pricing.
By the Numbers – Major Drawdown Events Side-by-Side
| Drawdown Event | Quarters Lasted | Max Drawdown | Quarters to Max Drawdown | Quarters to Recovery | ||||
| Public REITs | Private RE | Public REITs | Private RE | Public REITs | Private RE | Public REITs | Private RE | |
| 1987 Crash (Aug 87 - Mar 89) | 6 | N/A | -18% | N/A | 1 | N/A | 5 | N/A |
| S&L Crisis (1989 - 1990) | 14 | 12 | -23% | -10.9% | 4.5 | 8 | 0 | 9 |
| GFC (2007 - 2013) | 19 | 14 | -70% | -24% | 7 | 2 | 12 | 8 |
| COVID 19 (2020) | 4 | 1 | -24% | -1% | 1 | N/A | 3 | N/A |
| Fed Fund Rate Increase (2022 - 2023) | 6 | 2 | -28% | -5% | 3 | 2 | N/A | N/A |
Conclusion
Many market participants believe public REIT performance leads private real estate market performance. This analysis challenges that assertion as the data show:
- Small public REIT drawdowns have not predicted private real estate drawdowns
- Larger public REIT drawdowns have only predicted private market drawdowns in a few cases
- Private real estate value declines have been far lower than public REIT drawdowns
- Public REIT performance has predicted only about 10% of private market declines

